Now that we have turned the corner into a new year it is fun to look back on what I did and how it compares to the past. I know I’m getting older but hope my riding is holding up. My obsession with logging rides with the GPS and tracking it on Strava gives me access to some powerful analytical tools.
Strava gives us the calendar and training log and then there is the fun stuff like heat maps and the Strava Labs add-ons that others have programmed using the Strava APIs. Marcello Brivio is a guy who has created all sorts of crazy data mining tools called “Toolbox for Strava” that any Strava junkie can use.
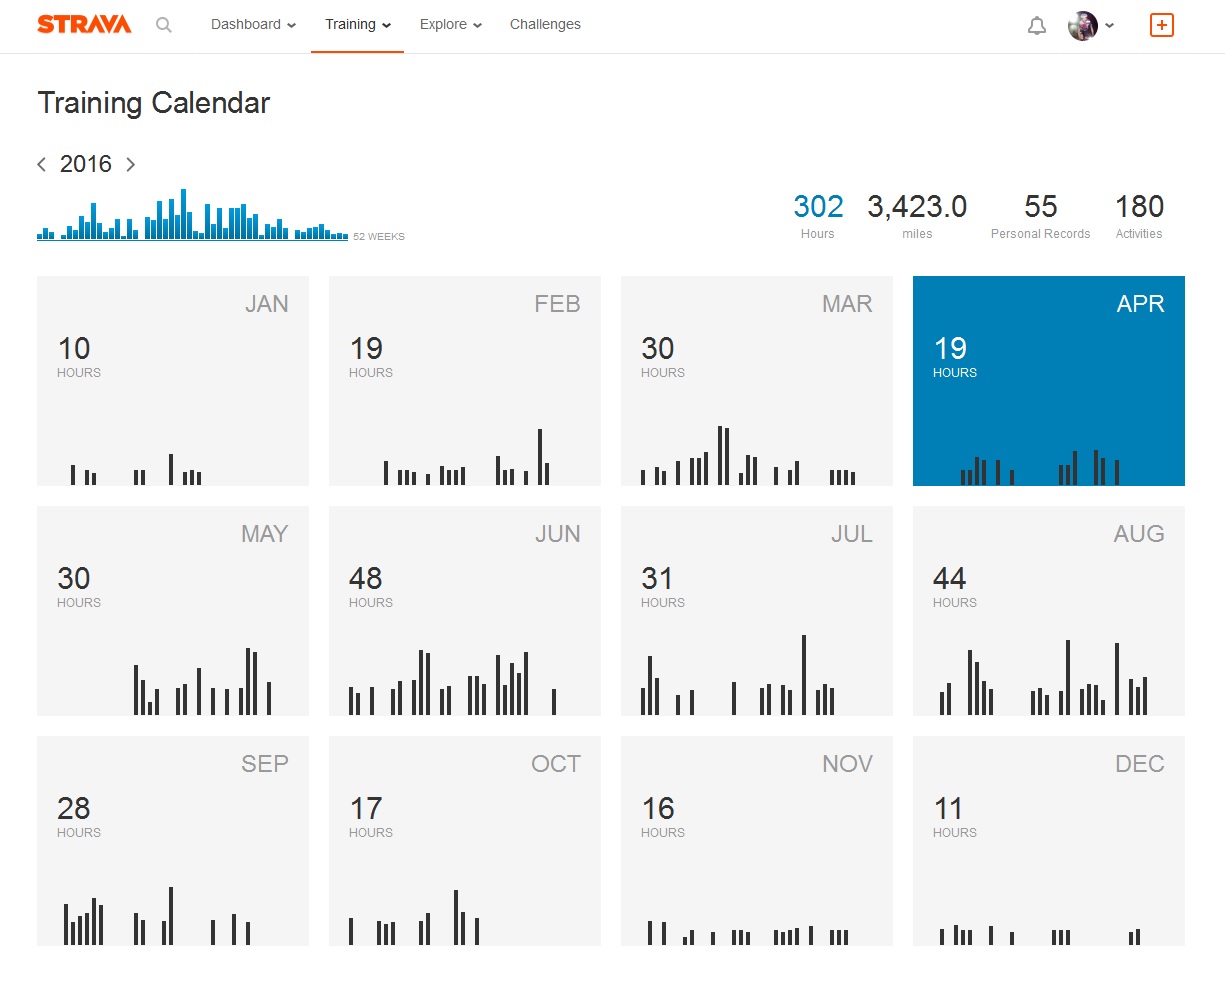
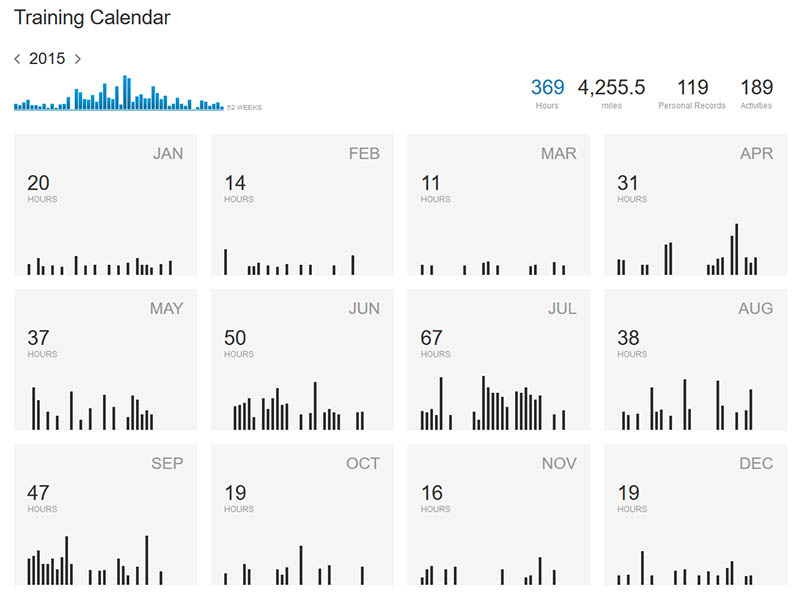
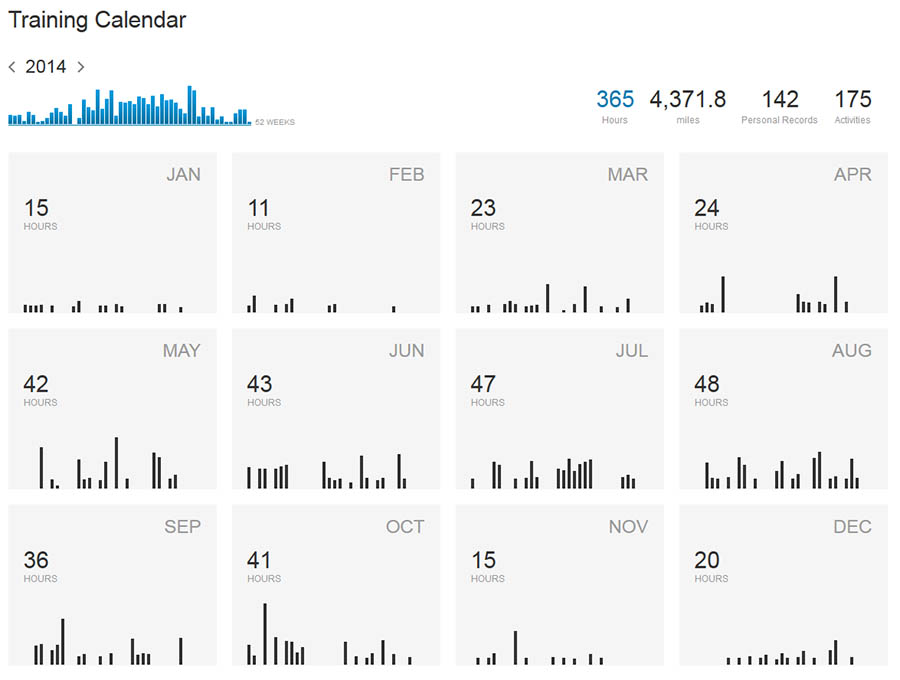
My calendar for 2016 shows 302 hours for 3423 miles, 55 PRs in 180 activities. That sounds good until I look back to 2015 when I racked up 369, 4255, 119 and 189. Just 9 fewer rides in 2016 but almost 800 fewer miles and less than half the number of PRs. And 2014 looks a lot like 2015. Uh-oh!
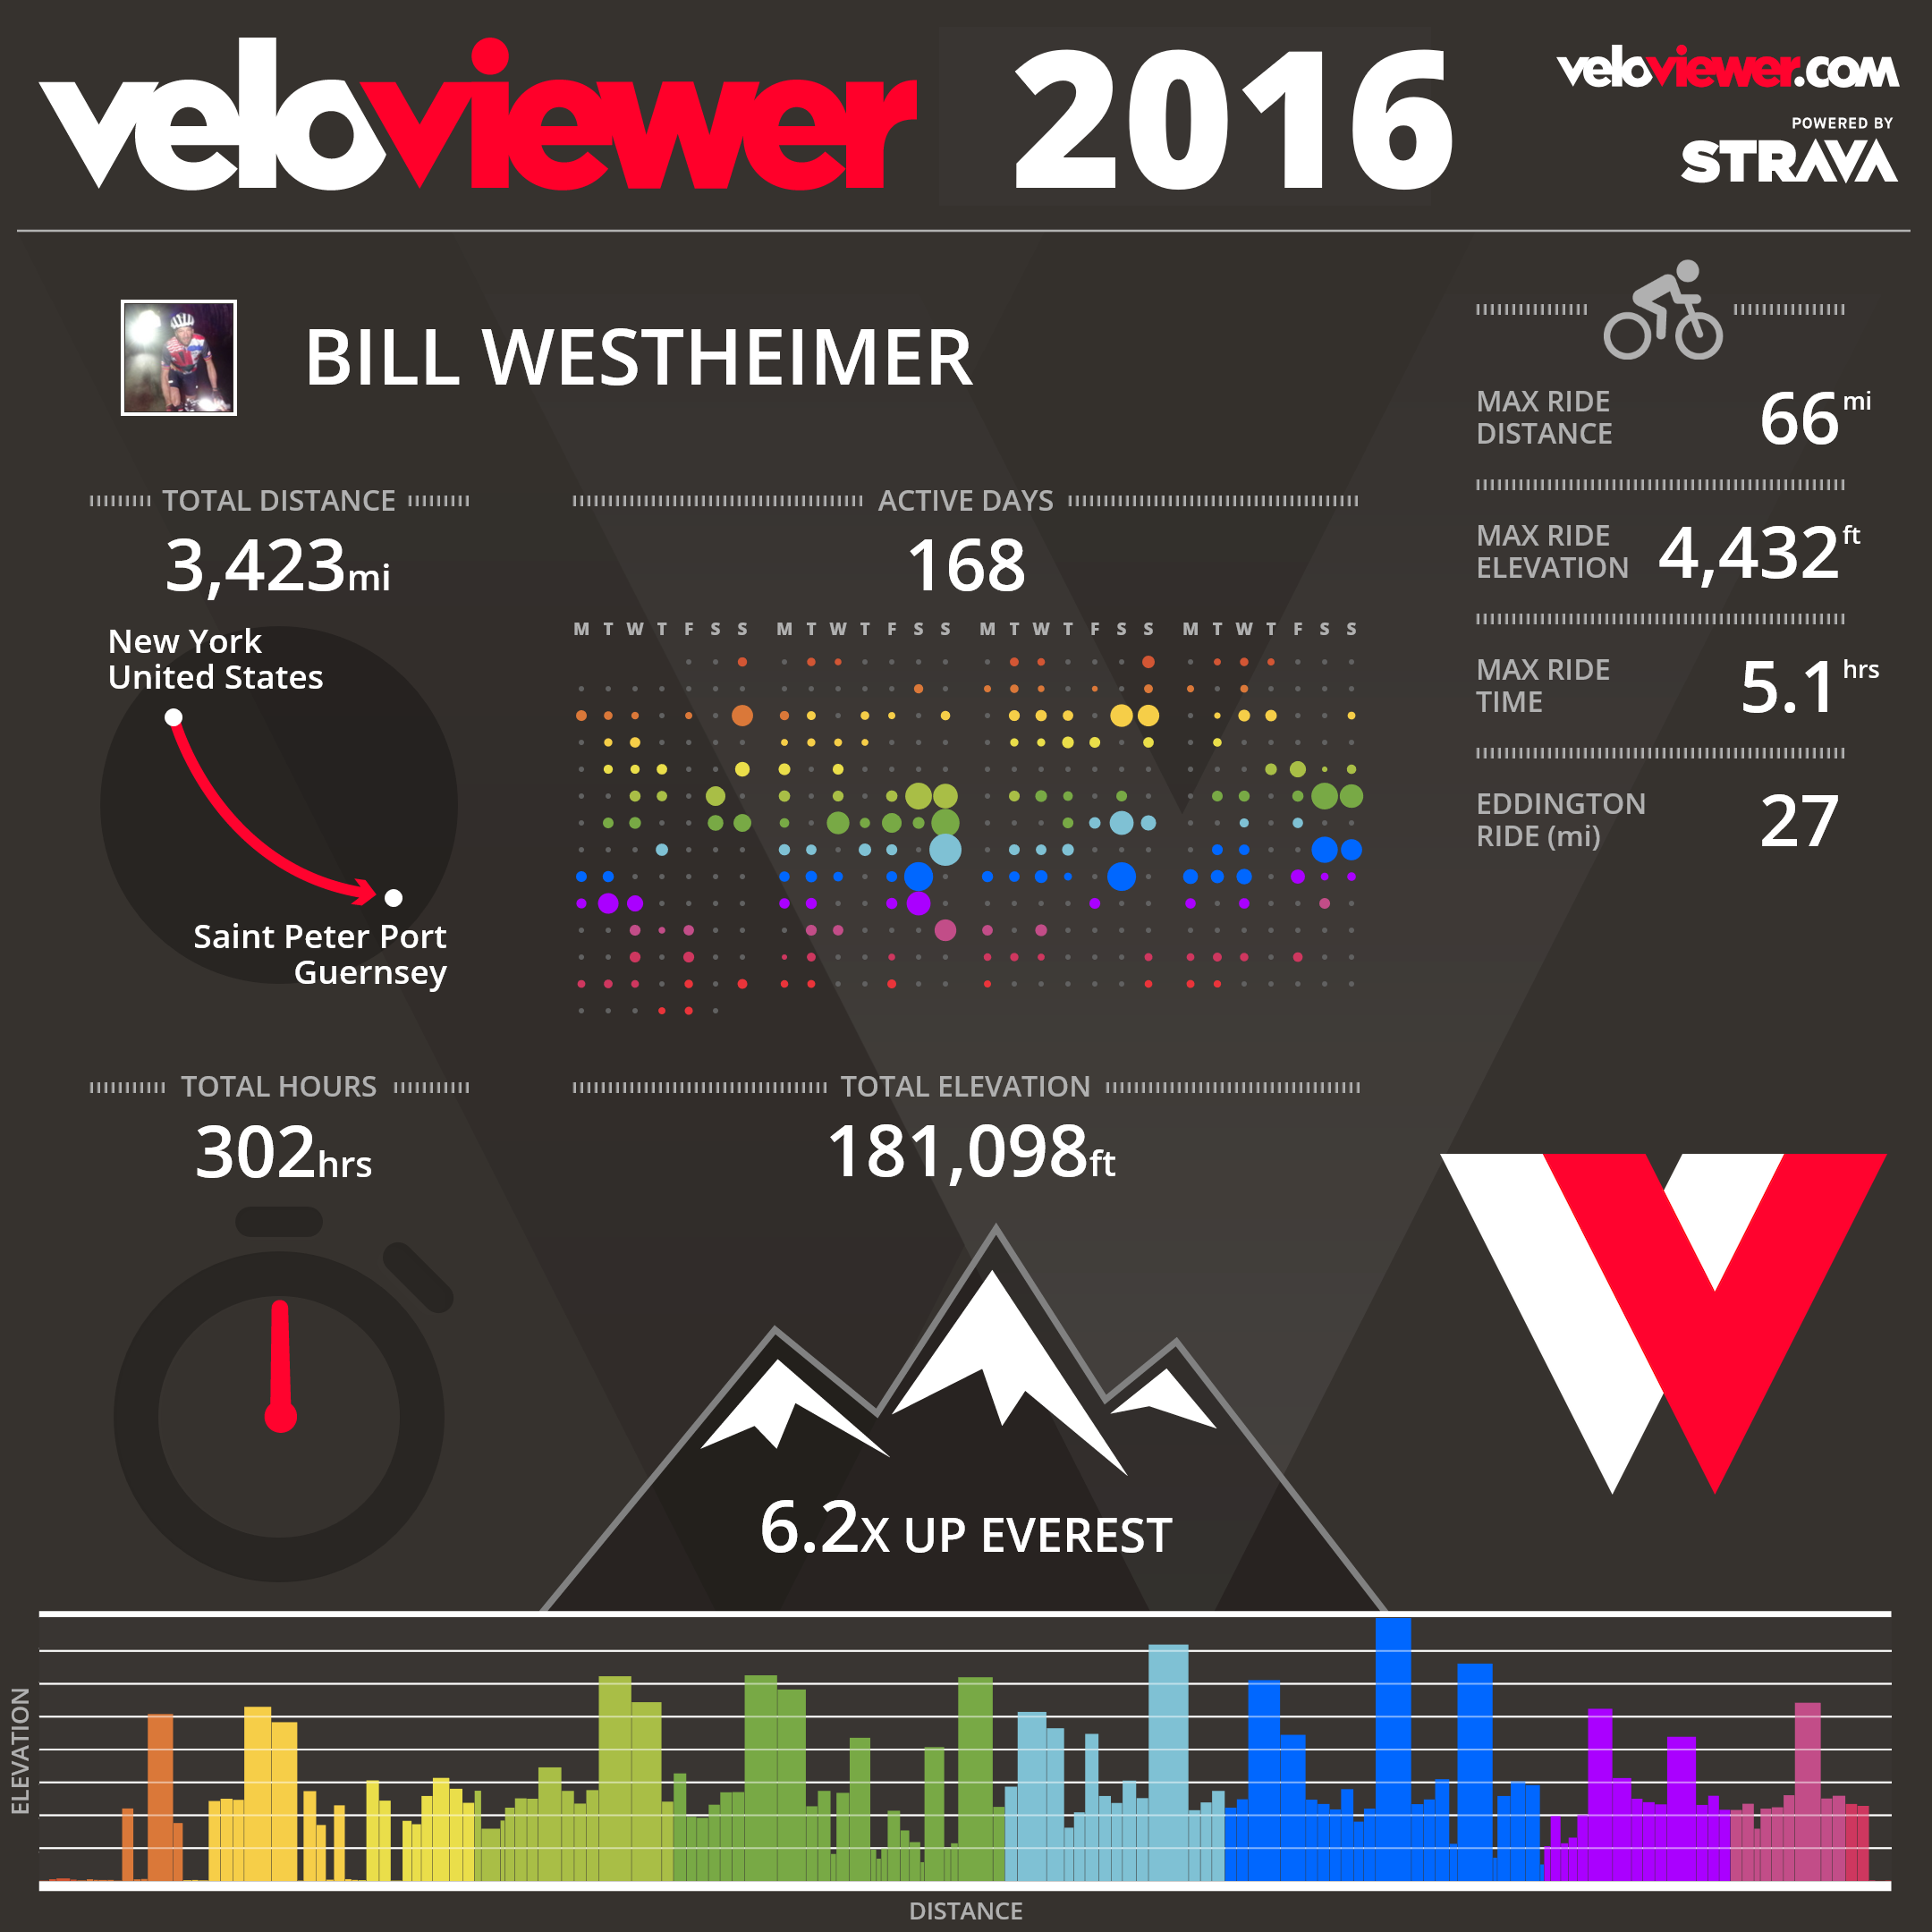
 But there is a great way to aggregate all of that data – Veloviewer.com where you can drown yourself and bore others with every kind of analysis and graphic imaginable. This is one they want people to share on social media:
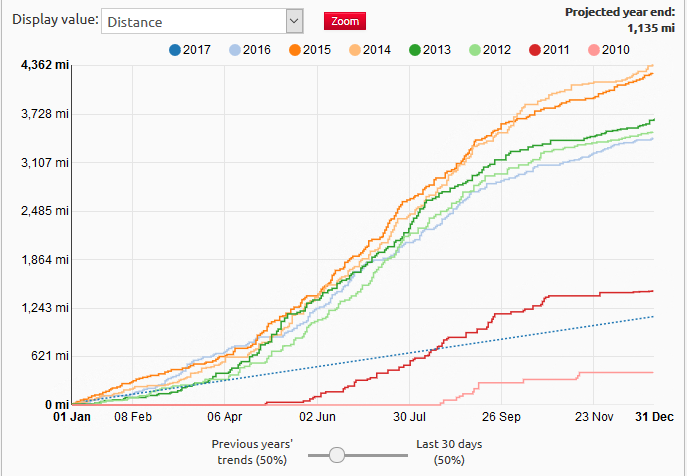
 But this one is the best comparison of year to year mileage accomplishments:
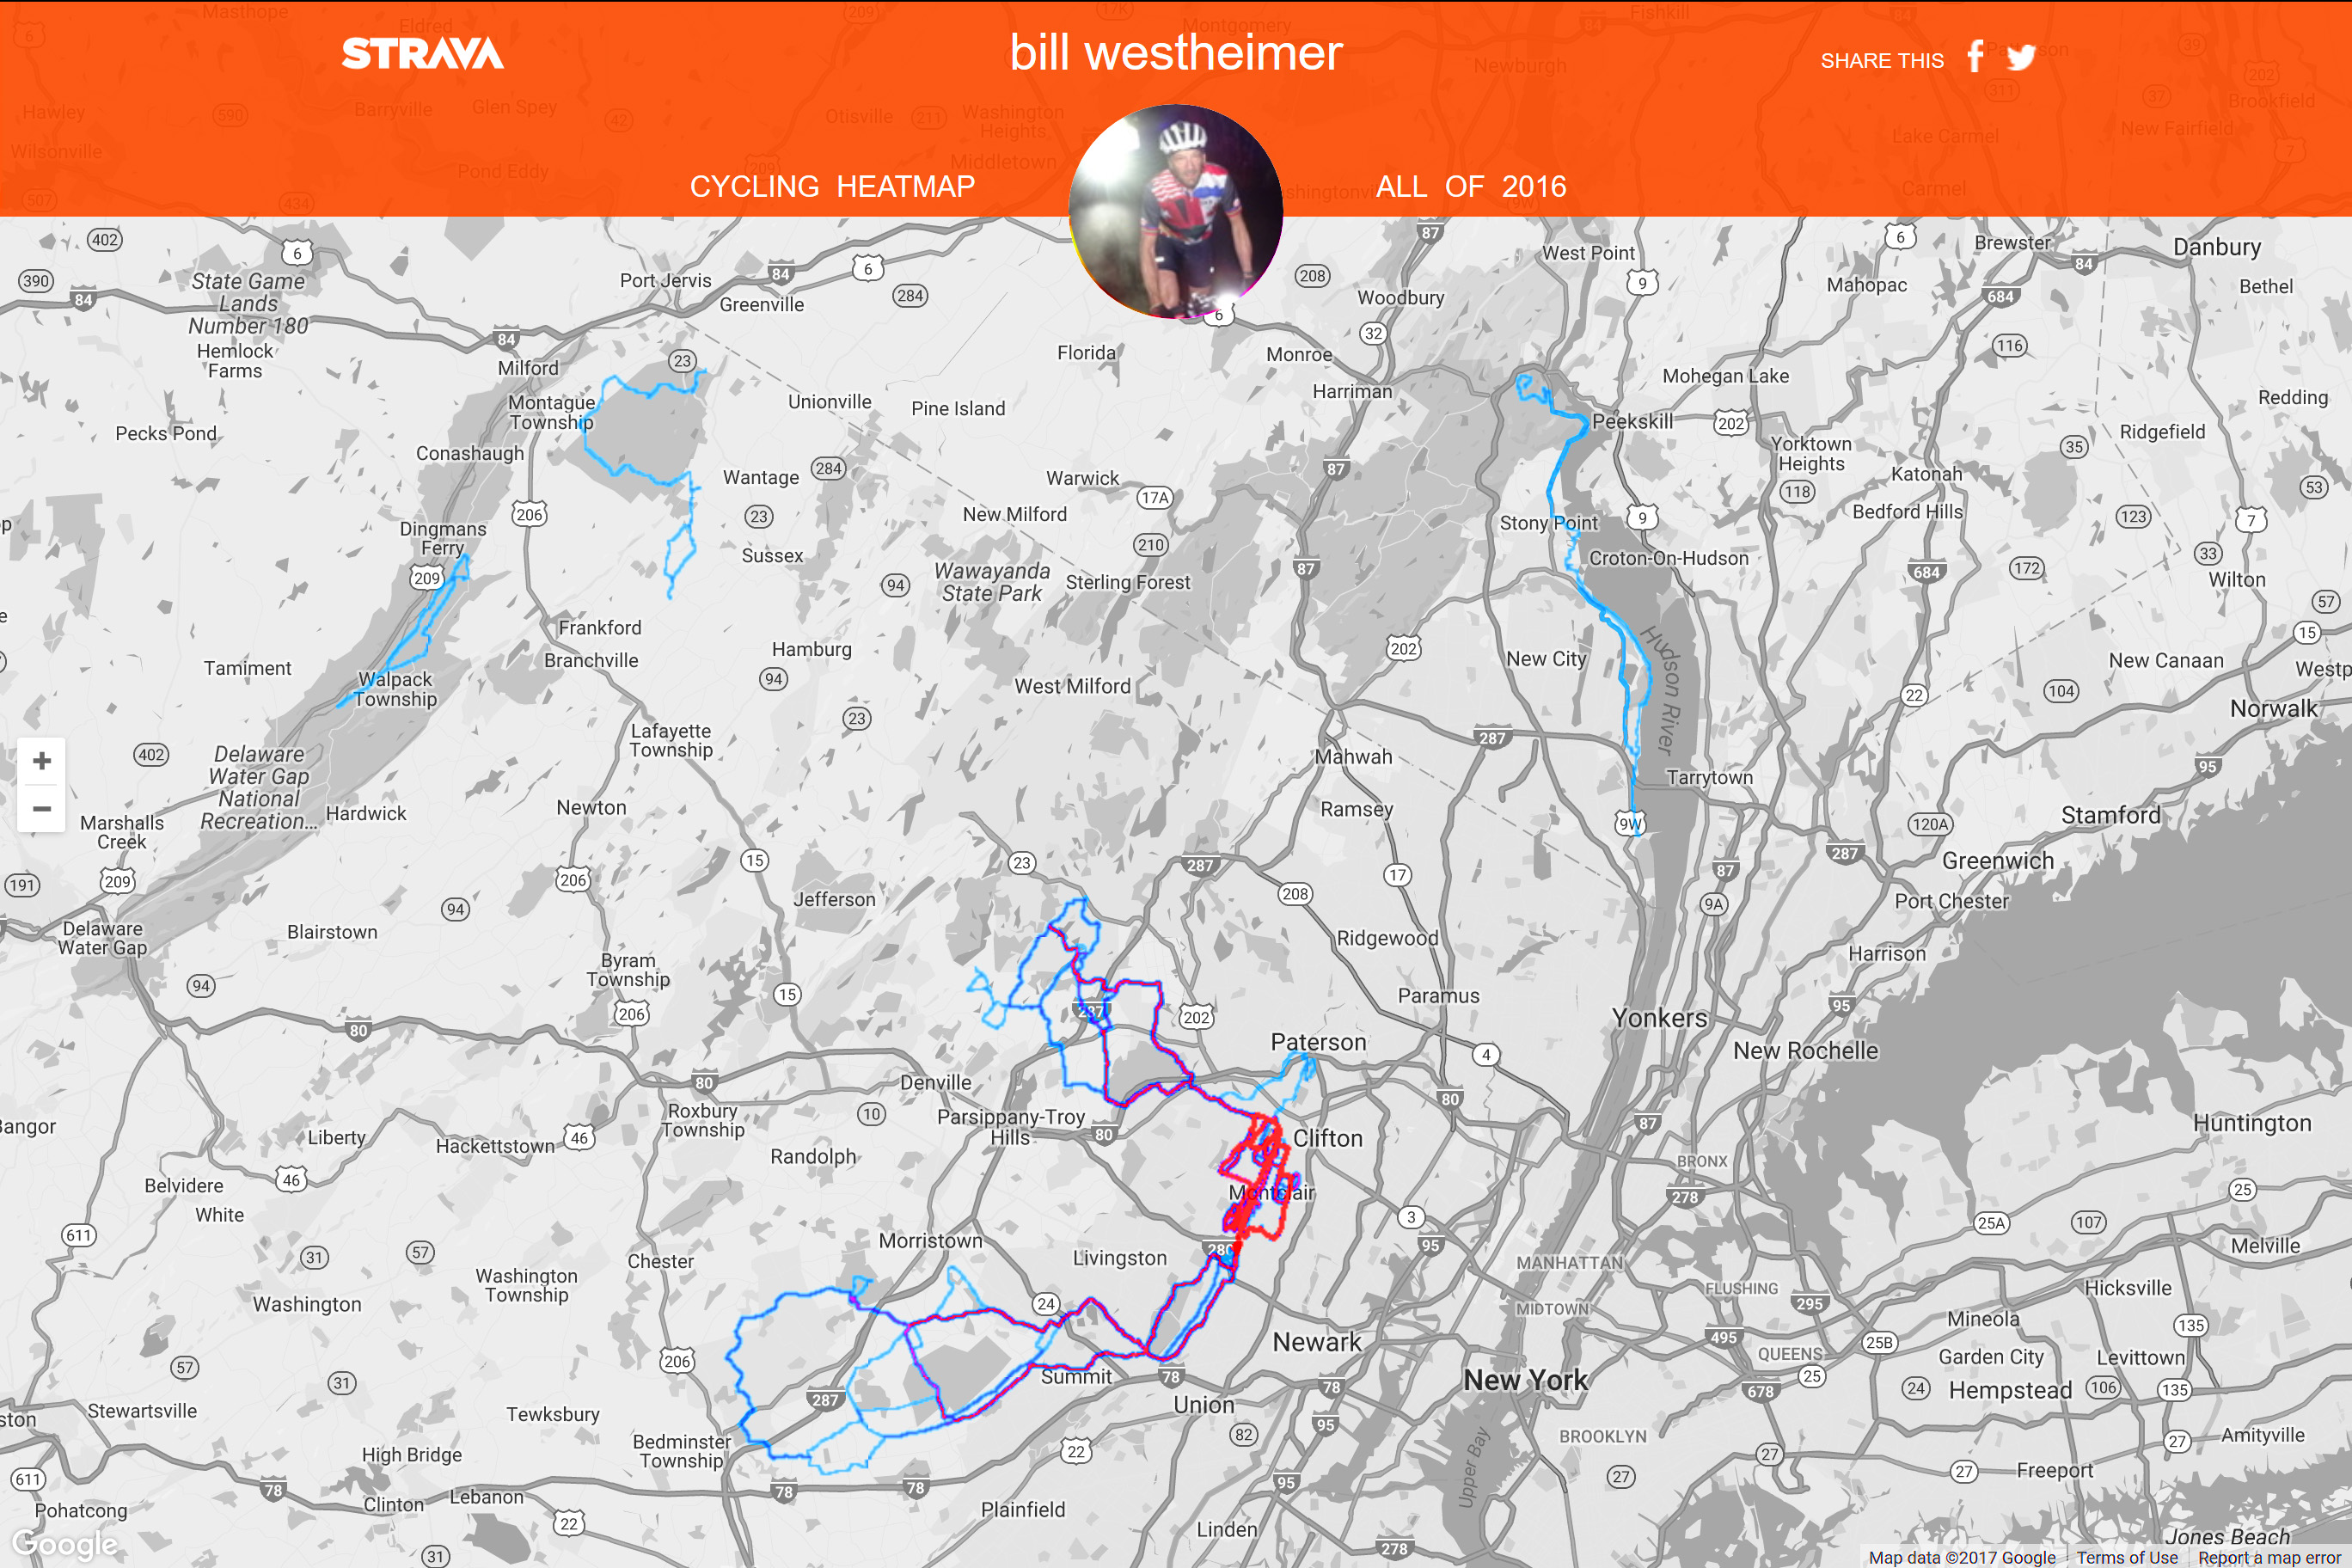
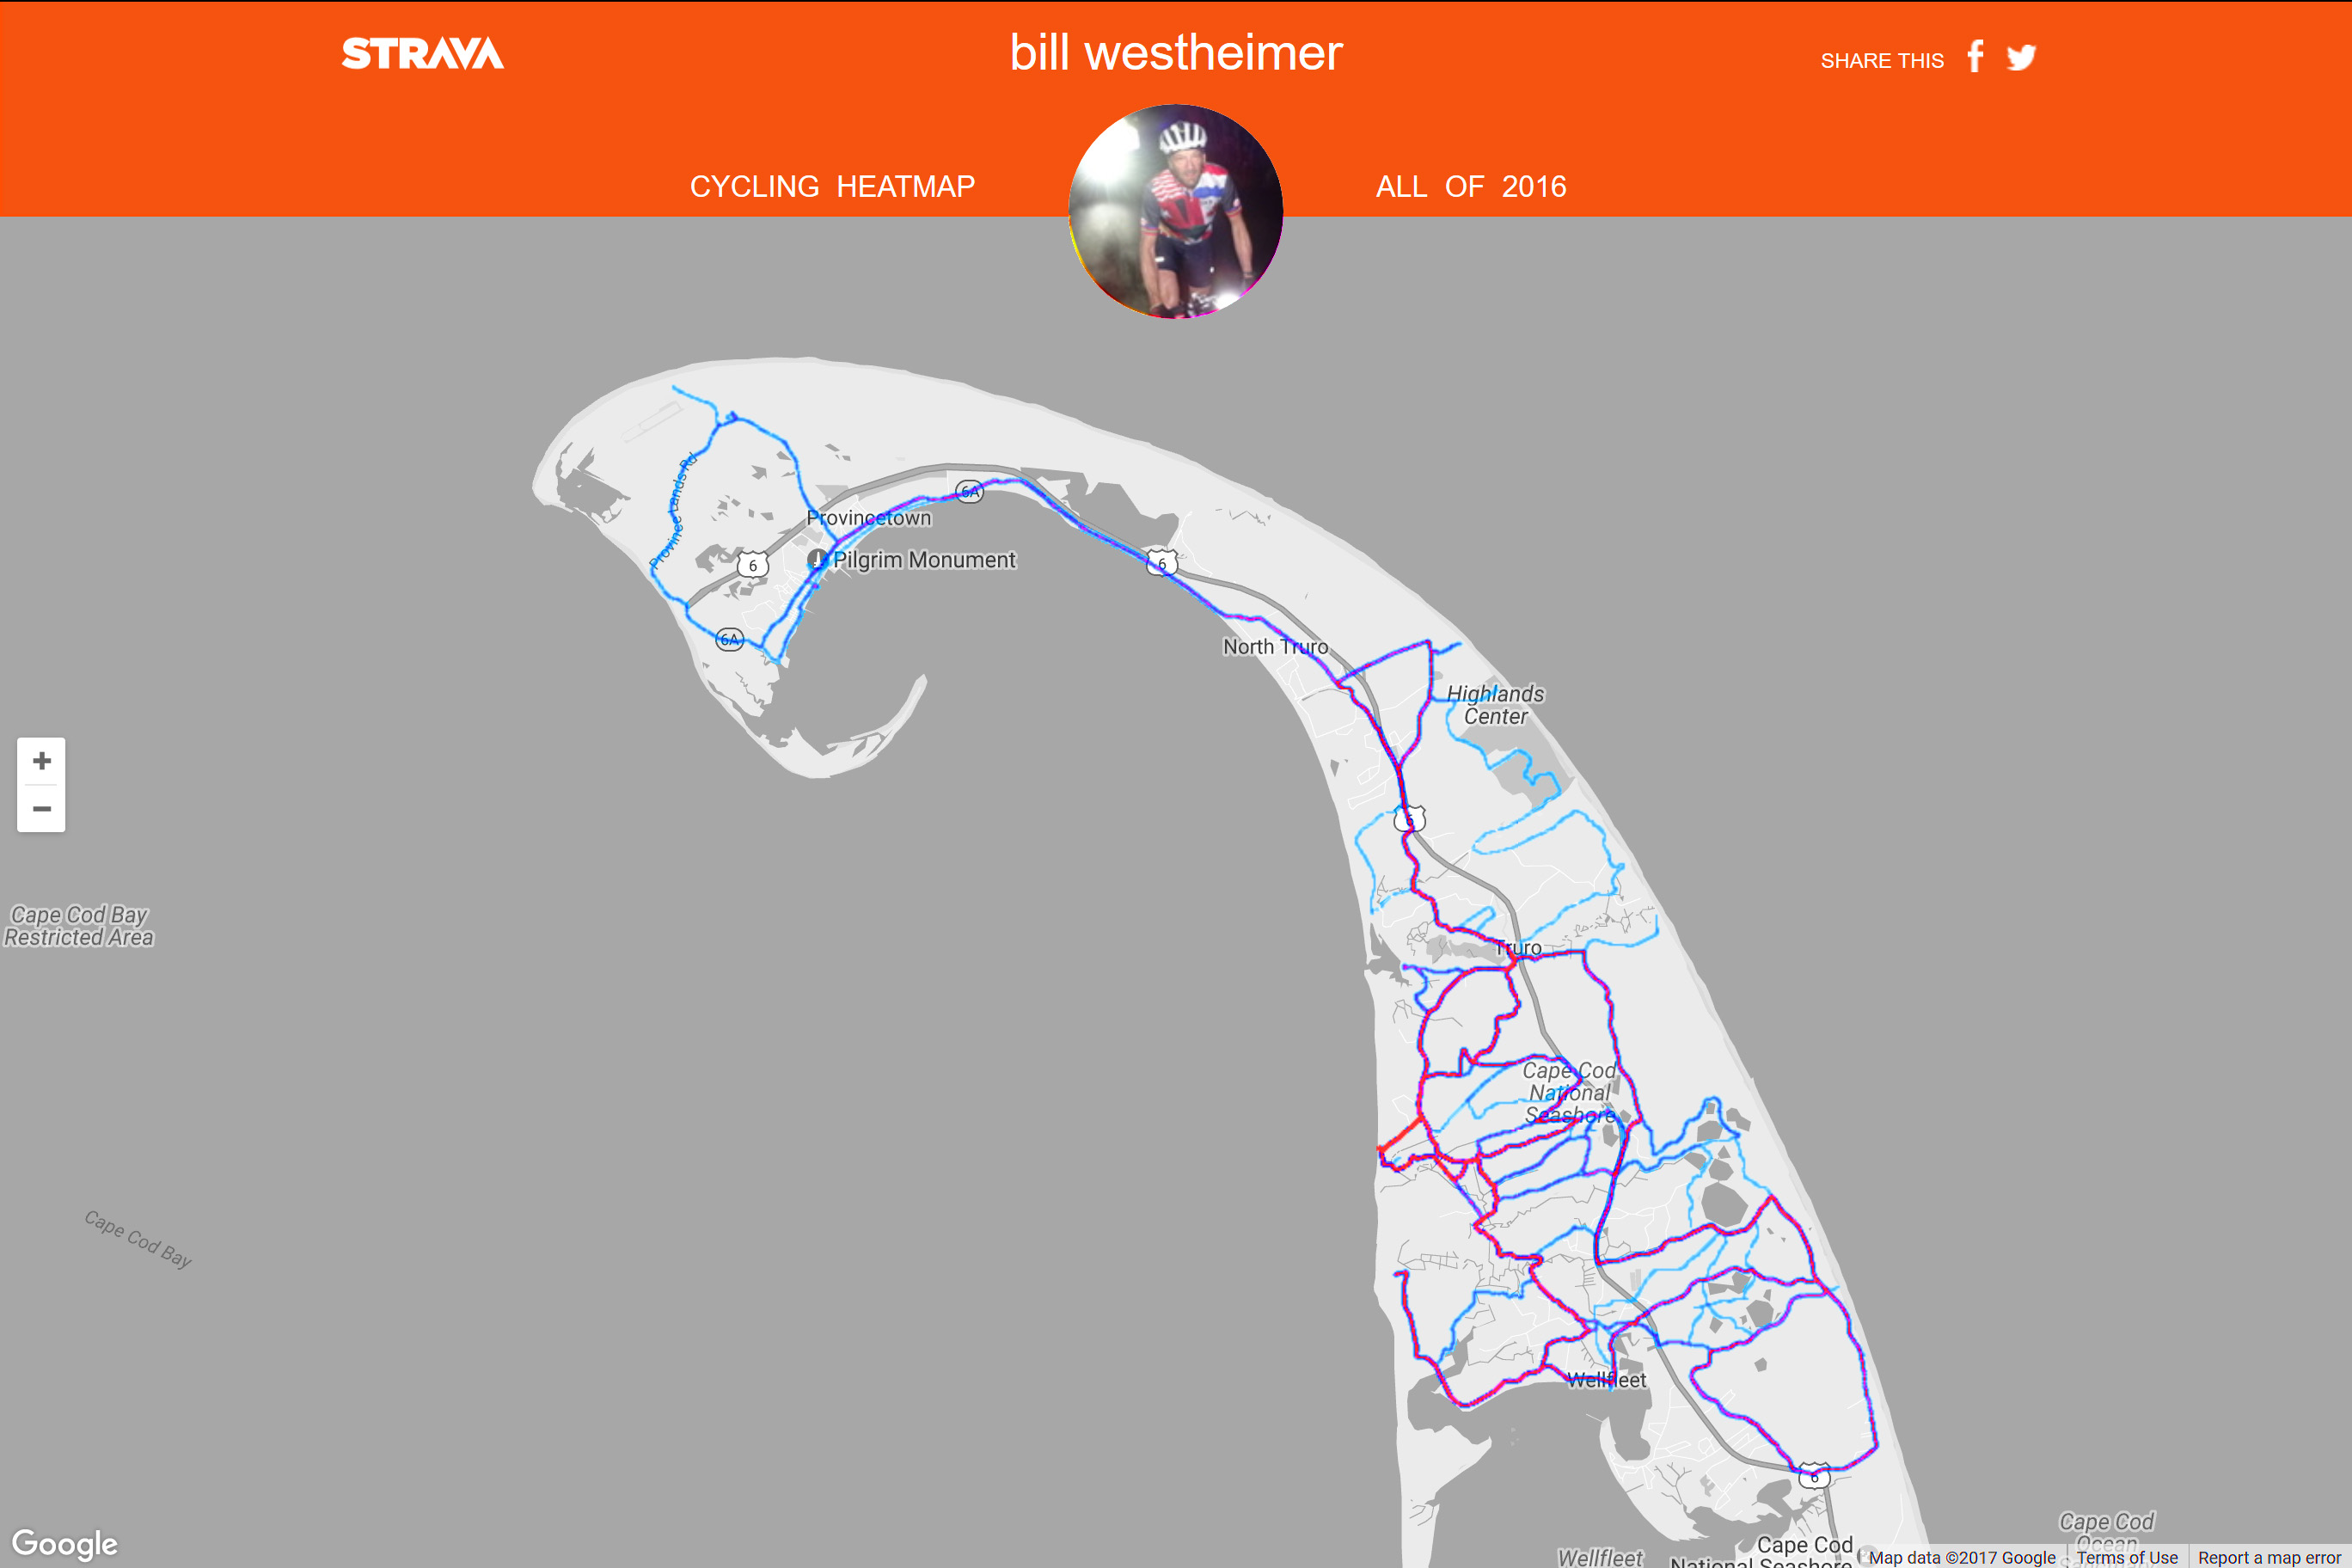
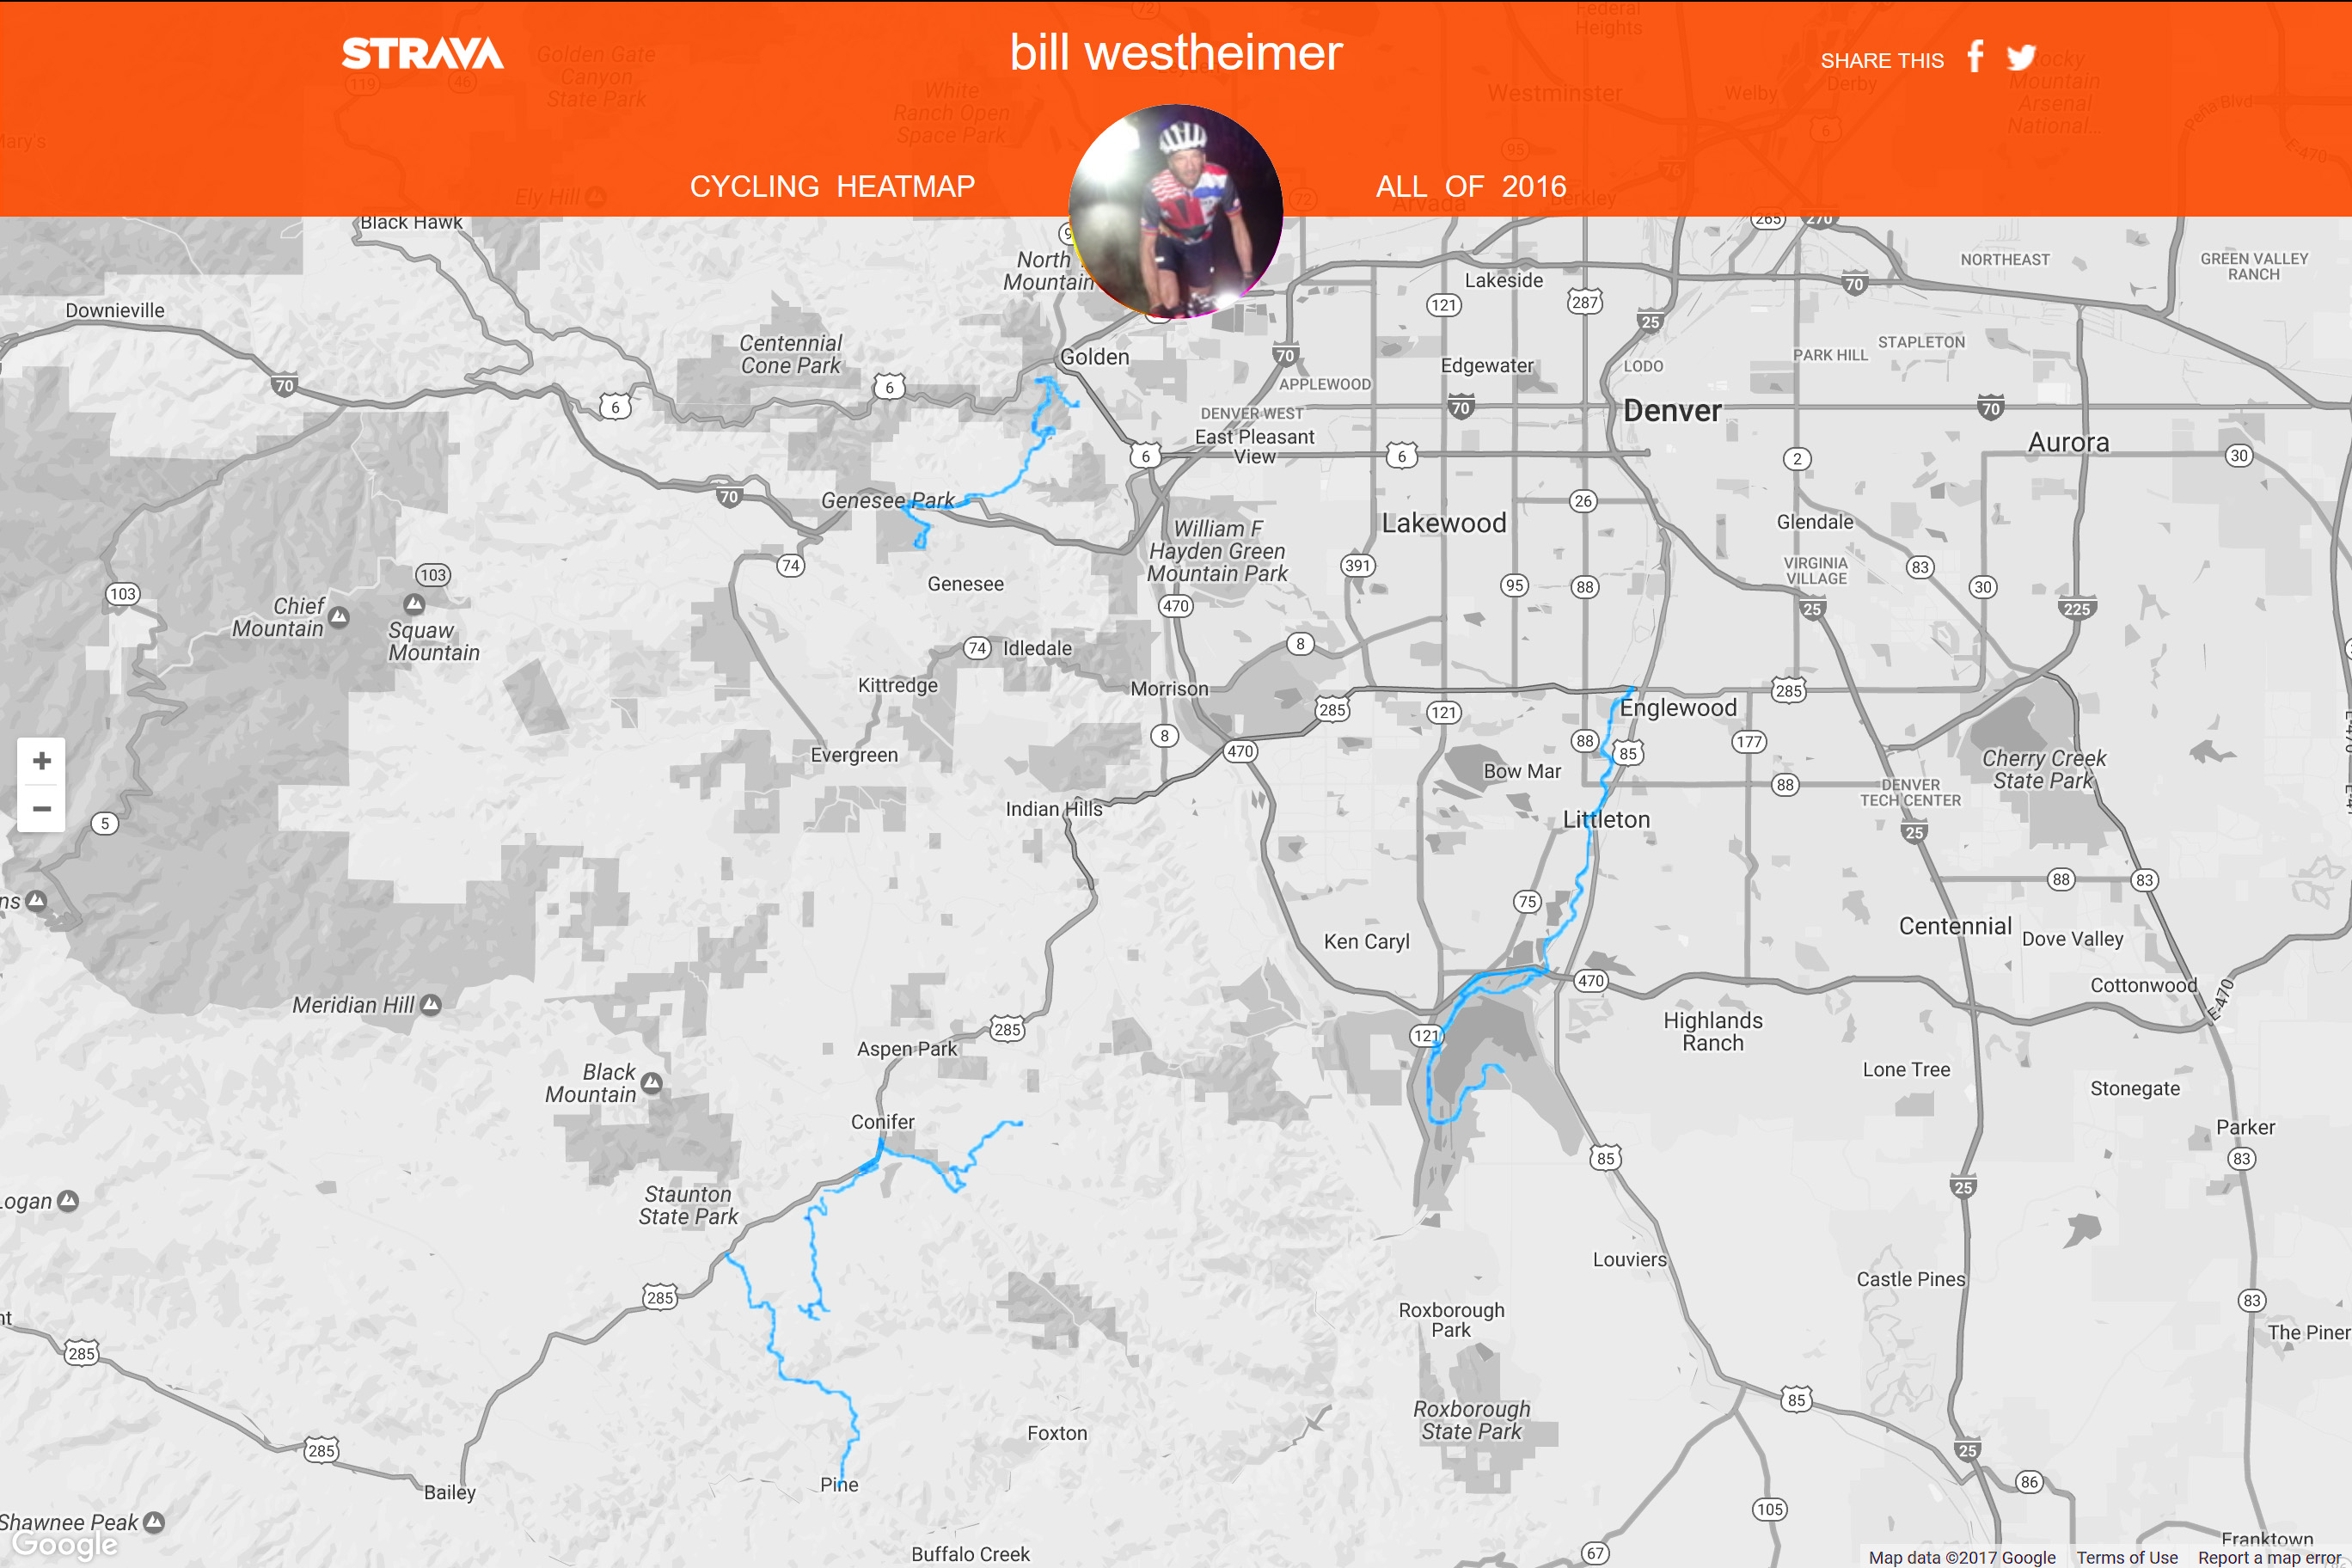
 And I love the heatmaps which Strava produces – I have zoomed into the 3 areas I rode last year: Northern NJ/NY, Cape Cod and Colorado. Sorry, nothing in France or California last year.
So as I grind away indoors watching Sufferfest videos for the next few months I will think back on some good riding while dreaming up some new adventures for 2017 to put on my “Bike-It List.” I hope to have some great new rides in Colorado in 2017, I’ve been scoping out routes around my new cabin. Stay tuned